 Semantic portal
Android Studio and IntelliJ
Installation and setup
Follow the Set up an editor instructions to install the Dart and Flutter plugins.
Updating the plugins
Updates to the plugins are shipped on a regular basis. You should be prompted in the IDE when an update is available.
To check for updates manually:
- Open preferences (Android Studio > Check for Updates on macOS, Help > Check for Updates on Linux).
-
If
dartorflutterare listed, update them.
Creating projects
You can create a new project in one of several ways.
Creating a new project
To create a new Flutter project from the Flutter starter app template:
- In the IDE, click Create New Project from the Welcome window or File > New > Project from the main IDE window.
- Select Flutter in the menu, and click Next.
- Enter your desired Project name and Project location.
- If you might publish this app, set the company domain.
- Click Finish.
Creating a new project from existing source code
To create a new Flutter project containing existing Flutter source code files:
-
In the IDE, click Create New Project from the Welcome window or File > New > Project from the main IDE window.
- Select Flutter in the menu, and click Next.
- Under Project location enter, or browse to, the directory holding your existing Flutter source code files.
- Click Finish.
Editing code and viewing issues
The Flutter plugin performs code analysis that enables the following:
- Syntax highlighting.
- Code completions based on rich type analysis.
- Navigating to type declarations (Navigate > Declaration), and finding type usages (Edit > Find > Find Usages).
-
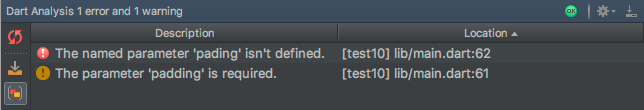
Viewing all current source code problems (View > Tool Windows > Dart Analysis). Any analysis issues are shown in the Dart Analysis pane:
Running and debugging
Running and debugging are controlled from the main toolbar:
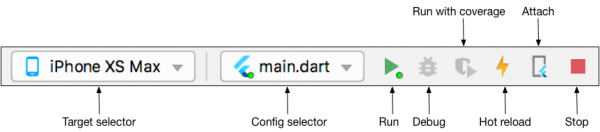
Selecting a target
When a Flutter project is open in the IDE, you should see a set of Flutter-specific buttons on the right-hand side of the toolbar.
- Locate the Flutter Target Selector drop-down button. This shows a list of available targets.
- Select the target you want your app to be started on. When you connect devices, or start simulators, additional entries appear.
Run app without breakpoints
- Click the Play icon in the toolbar, or invoke Run > Run. The bottom Run pane shows logs output.
Run app with breakpoints
- If desired, set breakpoints in your source code.
-
Click the Debug icon in the toolbar, or invoke Run > Debug.
- The bottom Debugger pane shows Stack Frames and Variables.
- The bottom Console pane shows detailed logs output.
- Debugging is based on a default launch configuration. To customize this, click the drop-down button to the right of the device selector, and select Edit configuration.
Fast edit and refresh development cycle
Flutter offers a best-in-class developer cycle enabling you to see the effect of your changes almost instantly with the Stateful Hot Reload feature. See Hot reload for details.
Show performance data
To view the performance data, including the widget rebuild information, start the app in Debug mode, and then open the Performance tool window using View > Tool Windows > Flutter Performance.
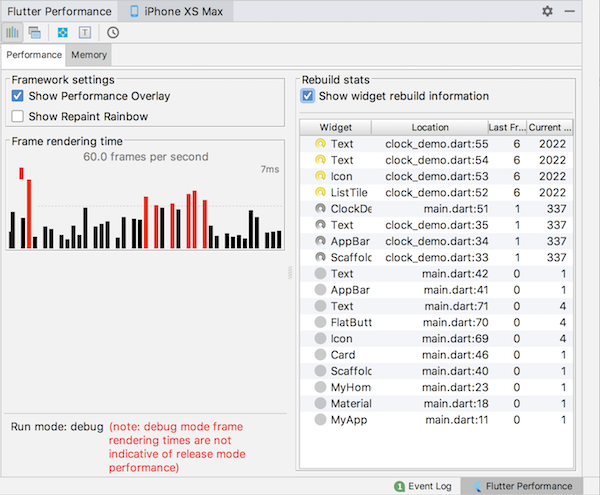
To see the stats about which widgets are being rebuilt, and how often, click Show widget rebuild information in the Performance pane. The exact count of the rebuilds for this frame displays in the second column from the right. For a high number of rebuilds, a yellow spinning circle displays. The column to the far right shows how many times a widget was rebuilt since entering the current screen. For widgets that aren’t rebuilt, a solid grey circle displays. Otherwise, a grey spinning circle displays.
The purpose of this feature is to make you aware when widgets are rebuilding—you might not realize that this is happening when just looking at the code. If widgets are rebuilding that you didn’t expect, it’s probably a sign that you should refactor your code by splitting up large build methods into multiple widgets.
This tool can help you debug at least four common performance issues:
-
The whole screen (or large pieces of it) are built by a single StatefulWidget, causing unnecessary UI building. Split up the UI into smaller widgets with smaller
build()functions. -
Offscreen widgets are being rebuilt. This can happen, for example, when a ListView is nested in a tall Column that extends offscreen. Or when the RepaintBoundary is not set for a list that extends offscreen, causing the whole list to be redrawn.
-
The
build()function for an AnimatedBuilder draws a subtree that does not need to be animated, causing unnecessary rebuilds of static objects. -
An Opacity widget is placed unnecessarily high in the widget tree. Or, an Opacity animation is created by directly manipulating the opacity property of the Opacity widget, causing the widget itself and its subtree to rebuild.
You can click on a line in the table to navigate to the line in the source where the widget is created. As the code runs, the spinning icons also display in the code pane to help you visualize which rebuilds are happening.
Note that numerous rebuilds doesn’t necessarily indicate a problem. Typically you should only worry about excessive rebuilds if you have already run the app in profile mode and verified that the performance is not what you want.
And remember, the widget rebuild information is only available in a debug build. Test the app’s performance on a real device in a profile build, but debug performance issues in a debug build.
Editing tips for Flutter code
If you have additional tips we should share, let us know!
Assists & quick fixes
Assists are code changes related to a certain code identifier. A number of these are available when the cursor is placed on a Flutter widget identifier, as indicated by the yellow lightbulb icon. The assist can be invoked by clicking the lightbulb, or by using the keyboard shortcut (Alt+Enter on Linux and Windows, Option+Return on macOS), as illustrated here:
Quick Fixes are similar, only they are shown with a piece of code has an error and they can assist in correcting it. They are indicated with a red lightbulb.
Wrap with new widget assist
This can be used when you have a widget that you want to wrap in a surrounding widget, for example if you want to wrap a widget in a Row or Column.
Wrap widget list with new widget assist
Similar to the assist above, but for wrapping an existing list of widgets rather than an individual widget.
Convert child to children assist
Changes a child argument to a children argument, and wraps the argument value in a list.
Live templates
Live templates can be used to speed up entering typical code structures. They are invoked by typing their prefix, and then selecting it in the code completion window:
The Flutter plugin includes the following templates:
-
Prefix
stless: Create a new subclass ofStatelessWidget. -
Prefix
stful: Create a new subclass ofStatefulWidgetand its associated State subclass. -
Prefix
stanim: Create a new subclass ofStatefulWidgetand its associated State subclass, including a field initialized with anAnimationController.
You can also define custom templates in Settings > Editor > Live Templates.
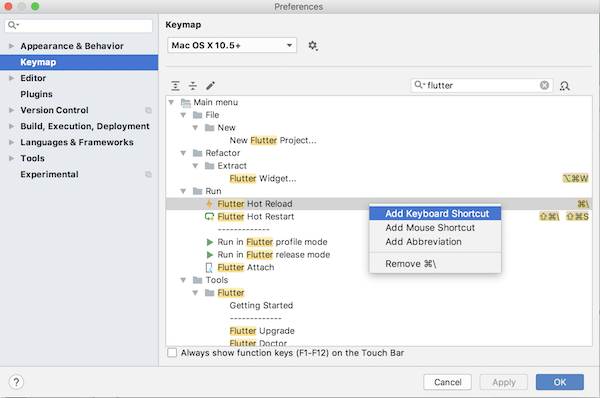
Keyboard shortcuts
Hot reload
On Linux (keymap Default for XWin) and Windows the keyboard shortcuts are Controle+Alt+; and Control+Backslash.
On macOS (keymap Mac OS X 10.5+ copy) the keyboard shortcuts are Command+Option and Command+Backslash.
Keyboard mappings can be changed in the IDE Preferences/Settings: Select Keymap, then enter flutter into the search box in the upper right corner. Right click the binding you want to change and Add Keyboard Shortcut.
Hot reload vs. hot restart
Hot reload works by injecting updated source code files into the running Dart VM (Virtual Machine). This includes not only adding new classes, but also adding methods and fields to existing classes, and changing existing functions. A few types of code changes cannot be hot reloaded though:
- Global variable initializers
- Static field initializers
-
The
main()method of the app
For these changes you can fully restart your application, without having to end your debugging session. To perform a hot restart, don’t click the Stop button, simply re-click the Run button (if in a run session) or Debug button (if in a debug session), or shift-click the ‘hot reload’ button.
Editing Android code in Android Studio with full IDE support
Opening the root directory of a Flutter project doesn’t expose all the Android files to the IDE. Flutter apps contain a subdirectory named android. If you open this subdirectory as its own separate project in Android Studio, the IDE will be able to fully support editing and refactoring all Android files (like Gradle scripts).
If you already have the entire project opened as a Flutter app in Android Studio, there are two equivalent ways to open the Android files on their own for editing in the IDE. Before trying this, make sure that you’re on the latest version of Android Studio and the Flutter plugins.
-
In the “project view”, you should see a subdirectory immediately under the root of your flutter app named
android. Right click on it, then select Flutter > Open Android module in Android Studio. -
OR, you can open any of the files under the
androidsubdirectory for editing. You should then see a “Flutter commands” banner at the top of the editor with a link labeled Open for Editing in Android Studio. Click that link.
For both options, Android Studio gives you the option to use separate windows or to replace the existing window with the new project when opening a second project. Either option is fine.
If you don’t already have the Flutter project opened in Android studio, you can open the Android files as their own project from the start:
- Click Open an existing Android Studio Project on the Welcome splash screen, or File > Open if Android Studio is already open.
-
Open the
androidsubdirectory immediately under the flutter app root. For example if the project is calledflutter_app, openflutter_app/android.
If you haven’t run your Flutter app yet, you might see Android Studio report a build error when you open the android project. Run flutter pub get in the app’s root directory and rebuild the project by selecting Build > Make to fix it.
Editing Android code in IntelliJ IDEA
To enable editing of Android code in IntelliJ IDEA, you need to configure the location of the Android SDK:
- In Preferences > Plugins, enable Android Support if you haven’t already.
- Right-click the android folder in the Project view, and select Open Module Settings.
- In the Sources tab, locate the Language level field, and select level 8 or later.
-
In the Dependencies tab, locate the Module SDK field, and select an Android SDK. If no SDK is listed, click New and specify the location of the Android SDK. Make sure to select an Android SDK matching the one used by Flutter (as reported by
flutter doctor). - Click OK.
Tips and tricks
Troubleshooting
Known issues and feedback
Important known issues that might impact your experience are documented in the Flutter plugin README file.
All known bugs are tracked in the issue trackers:
- Flutter plugin: GitHub issue tracker
- Dart plugin: JetBrains YouTrack
We welcome feedback, both on bugs/issues and feature requests. Prior to filing new issues:
- Do a quick search in the issue trackers to see if the issue is already tracked.
- Make sure you have updated to the most recent version of the plugin.
When filing new issues, include the output of flutter doctor.